
You are using an out of date browser. It may not display this or other websites correctly.
You should upgrade or use an alternative browser.
You should upgrade or use an alternative browser.
BRFR Cake Stop 'breaking news' miscellany
- Thread starter briantrumpet
- Start date
Page may contain affiliate links. Please see terms for details.


Ian H
Pharaoh
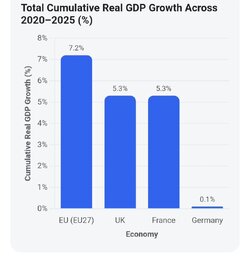
Brian - any thoughts on how those GDP figures make sense for an ardent rejoiner/remainer?
Is the EU still a large, active trading bloc, and would it make sense for the UK to reduce barriers to trade with them?
OP
OP

briantrumpet
Timewaster
Brian - any thoughts on how those GDP figures make sense for an ardent rejoiner/remainer?
Hence my posting the comment that it poses "headwind for rejoiners", while it also puts the "Rachel from accounts" criticism in a different light.
It's good news for the UK. But that doesn't mean that reducing as much friction as possible in trading with the EU won't be beneficial.

Psamathe
Squire
Personally I don't put much in the GDP figures. More relevant is GDP per capita. Increasing your population will increase your GDP but also increase Government costs eg quite possible to have GDP growth whilst also having GDP per capita drop and that in effect is a deteriorating state.
Also, there are components included in GDP that don’t really contribute to country output. Eg household spending - significant amount will be buying imported product. Eg things like war involve expenditure so count towards GDP but don't really indicate growth of the economy. Whilst GDP is meant to include services only those services where money changes hands ate included eg family unpaid caters are not included but a lot of caring is provided by unpaid family.
Similarly, few distinguish between Real GDP and Nominal GDP. Important distinction when you have inflation.
and GDP growth doesn't mean we are getting wealthier.

First Aspect
Squire
If you had asked me I would question the selection of countries.Brian - any thoughts on how those GDP figures make sense for an ardent rejoiner/remainer?
In the third quarter (Q3) of 2026, the United Kingdom recorded a real GDP growth rate of +0.7%, while the broader European Union (EU) grew by +0.5% and the Euro area grew by +0.4% compared to the previous quarter, according to data from the Office for National Statistics and Eurostat.
Q3 2026 Quarterly GDP Growth (Q/Q) - Key Figures & Country Data
Country / Aggregate Q3 2026 GDP Growth (Q/Q) Annual Change (YoY)
Ireland +5.5% N/A
United Kingdom +0.7% +1.9%
Netherlands +0.6% N/A
Spain +0.6% N/A
Estonia +0.6% N/A
European Union (EU-27) +0.5% +1.5%
Euro Area (EA-20) +0.4% +1.3%
Germany +0.2% N/A
France -0.1% N/A
Lithuania -1.0% N/A
(Note: Eurostat releases preliminary flash estimates by member state incrementally; complete final breakdowns for all 27 EU single market countries are updated in subsequent national accounts schedules.)
Highlights by Region
United Kingdom: Grew by 0.7% in Q3 2026 (following +0.5% in Q2), driven heavily by a 0.9% increase in the services sector.
European Union & Euro Area: EU GDP expanded by 0.5% quarterly (+1.5% year-on-year), while the Euro area grew by 0.4% (+1.3% year-on-year).
European Commission
Country Extremes: Ireland continued to post the highest reported quarterly growth at +5.5% (influenced by multinational and tech/AI-related output), whereas countries like Lithuania (-1.0%) and France (-0.1%) experienced contractions in Q3.
European Commission
+1
Would you like me to pull the detailed Q2 2026 data for all individual EU member states or focus on a specific country's sectoral breakdown?
AI responses may include mistakes. Learn more
Based on cumulative quarter-on-quarter real GDP growth through the latest 2026 national accounts releases from Eurostat and the Office for National Statistics, the United Kingdom has achieved an annualised year-to-date (YTD) growth rate of +2.42% (across Q1–Q3), outpacing the European Union (EU-27) at +1.74% and the Euro Area (EA-21) at +1.34%.
Methodology & Data Coverage
Annualisation Formula: Compounded YTD quarterly growth rates are annualised using
, where n is the number of reported quarters in 2026 (n=3 for countries with Q3 flash estimates; n=2 for countries reported through Q2).
EEA Scope: Includes all 27 EU member states plus Norway, Iceland, and Liechtenstein. Liechtenstein only publishes annual GDP figures (projected at +1.0% for 2026 by the IMF), so quarterly YTD annualisation is not available.
Trading Economics
+2
2026 Year-to-Date & Annualised Real GDP Growth (EEA, EU & UK)
Group 1: Countries with Q1–Q3 2026 Data Reported (n = 3 Quarters)
Country / Aggregate Q1 2026 (Q/Q) Q2 2026 (Q/Q) Q3 2026 (Q/Q) Cumulative YTD (9M) Annualised YTD Rate
Ireland (CSO Frontier) -7.8% +10.2% +5.5% +7.19% +9.70%
Spain +0.6% +0.7% +0.6% +1.91% +2.56%
Estonia +1.0% +0.3% +0.6% +1.91% +2.56%
United Kingdom +0.6% +0.5% +0.7% +1.81% +2.42%
Sweden -0.1% +1.5% +0.4% +1.80% +2.41%
Finland +0.7% +0.4% +0.5% +1.61% +2.15%
Netherlands +0.3% +0.7% +0.6% +1.61% +2.15%
European Union (EU-27) +0.1% +0.7% +0.5% +1.30% +1.74%
Portugal +0.2% +0.9% +0.2% +1.30% +1.74%
Hungary +0.6% +0.6% +0.1% +1.30% +1.74%
Euro Area (EA-21) 0.0% +0.6% +0.4% +1.00% +1.34%
Germany +0.4% +0.3% +0.2% +0.90% +1.21%
Czechia +0.1% +0.3% +0.5% +0.90% +1.20%
Belgium +0.2% +0.1% +0.3% +0.60% +0.80%
Italy +0.3% +0.2% 0.0% +0.50% +0.67%
Lithuania +0.1% +1.4% -1.0% +0.49% +0.65%
Austria +0.3% -0.1% +0.2% +0.40% +0.53%
France -0.2% 0.0% -0.1% -0.30% -0.40%
Group 2: Remaining EEA Countries with Q1–Q2 2026 Data Reported (n = 2 Quarters)
(Latest official quarterly figures compiled via Eurostat and Trading Economics; Q3 2026 national releases follow in late November and December.)
Country Q1 2026 (Q/Q) Q2 2026 (Q/Q) Cumulative YTD (6M) Annualised YTD Rate
Slovenia +1.1% +1.8% +2.92% +5.92%
Denmark +1.5% +0.9% +2.41% +4.89%
Poland +0.6% +1.0% +1.61% +3.24%
Malta +0.5% +1.1% +1.61% +3.24%
Bulgaria +0.7% +0.7% +1.40% +2.83%
Latvia +0.6% +0.7% +1.30% +2.63%
Norway (EEA) +0.4% +0.7% +1.10% +2.22%
Cyprus +0.2% +0.8% +1.00% +2.01%
Iceland (EEA) +3.7% -3.0% +0.59% +1.18%
Greece +0.2% +0.3% +0.50% +1.00%
Slovakia +0.2% +0.2% +0.40% +0.80%
Croatia -0.1% +0.4% +0.30% +0.60%
Romania -0.1% 0.0% -0.10% -0.20%
Luxembourg +0.3% -0.9% -0.60% -1.20%
Liechtenstein (EEA) Annual only Annual only N/A +1.00% (IMF Full-Year)
Key Takeaways
Major Economy Divergence: Among Europe's largest economies, Spain (+2.56% annualised) and the UK (+2.42% annualised) lead growth. Germany (+1.21%) and Italy (+0.67%) show modest positive momentum, while France (-0.40%) is in mild YTD contraction.
ICIS
Volatility Distortion: Ireland (+9.70% annualised) reflects heavy swings from multinational intellectual property and AI capital transfers (-7.8% in Q1 followed by +10.2% in Q2 and +5.5% in Q3). Similarly, Iceland (+1.18% annualised) saw a +3.7% Q1 surge largely offset by a -3.0% Q2 trade-driven contraction.
Statistics Iceland
+2
Eurostat releases its updated t+45 flash estimate on 13 November 2026 and comprehensive Q3 country breakdowns on 7 December 2026. Would you like me to set up a task to update this table once the remaining EEA countries report their Q3 figures, or compare these annualised rates against full-year 2026 IMF and OECD forecasts?
AI responses may include mistakes. Learn more
Here are the tables formatted in clean Markdown and CSV so you can easily copy and paste them into documents, emails, Slack, Notion, or spreadsheet software like Excel and Google Sheets.
Option 1: Clean Markdown (Best for Notion, Slack, GitHub, or Docs)
(Click the copy icon in the top-right corner of the code block below.)
markdown
### 2026 Year-to-Date & Annualised Real GDP Growth (EEA, EU & UK)
#### Group 1: Countries with Q1–Q3 2026 Data Reported (n = 3 Quarters)
| Country / Aggregate | Q1 2026 | Q2 2026 | Q3 2026 | Cumulative YTD (9M) | Annualised YTD Rate |
| :--- | :--- | :--- | :--- | :--- | :--- |
| Ireland | -7.8% | +10.2% | +5.5% | +7.19% | +9.70% |
| Spain | +0.6% | +0.7% | +0.6% | +1.91% | +2.56% |
| Estonia | +1.0% | +0.3% | +0.6% | +1.91% | +2.56% |
| United Kingdom | +0.6% | +0.5% | +0.7% | +1.81% | +2.42% |
| Sweden | -0.1% | +1.5% | +0.4% | +1.80% | +2.41% |
| Finland | +0.7% | +0.4% | +0.5% | +1.61% | +2.15% |
| Netherlands | +0.3% | +0.7% | +0.6% | +1.61% | +2.15% |
| European Union (EU-27) | +0.1% | +0.7% | +0.5% | +1.30% | +1.74% |
| Portugal | +0.2% | +0.9% | +0.2% | +1.30% | +1.74% |
| Hungary | +0.6% | +0.6% | +0.1% | +1.30% | +1.74% |
| Euro Area (EA-21) | 0.0% | +0.6% | +0.4% | +1.00% | +1.34% |
| Germany | +0.4% | +0.3% | +0.2% | +0.90% | +1.21% |
| Czechia | +0.1% | +0.3% | +0.5% | +0.90% | +1.20% |
| Belgium | +0.2% | +0.1% | +0.3% | +0.60% | +0.80% |
| Italy | +0.3% | +0.2% | 0.0% | +0.50% | +0.67% |
| Lithuania | +0.1% | +1.4% | -1.0% | +0.49% | +0.65% |
| Austria | +0.3% | -0.1% | +0.2% | +0.40% | +0.53% |
| France | -0.2% | 0.0% | -0.1% | -0.30% | -0.40% |
#### Group 2: Remaining EEA Countries with Q1–Q2 2026 Data Reported (n = 2 Quarters)
| Country | Q1 2026 | Q2 2026 | Cumulative YTD (6M) | Annualised YTD Rate |
| :--- | :--- | :--- | :--- | :--- |
| Slovenia | +1.1% | +1.8% | +2.92% | +5.92% |
| Denmark | +1.5% | +0.9% | +2.41% | +4.89% |
| Poland | +0.6% | +1.0% | +1.61% | +3.24% |
| Malta | +0.5% | +1.1% | +1.61% | +3.24% |
| Bulgaria | +0.7% | +0.7% | +1.40% | +2.83% |
| Latvia | +0.6% | +0.7% | +1.30% | +2.63% |
| Norway (EEA) | +0.4% | +0.7% | +1.10% | +2.22% |
| Cyprus | +0.2% | +0.8% | +1.00% | +2.01% |
| Iceland (EEA) | +3.7% | -3.0% | +0.59% | +1.18% |
| Greece | +0.2% | +0.3% | +0.50% | +1.00% |
| Slovakia | +0.2% | +0.2% | +0.40% | +0.80% |
| Croatia | -0.1% | +0.4% | +0.30% | +0.60% |
| Romania | -0.1% | 0.0% | -0.10% | -0.20% |
| Luxembourg | +0.3% | -0.9% | -0.60% | -1.20% |
| Liechtenstein (EEA) | N/A | N/A | N/A | +1.00% (IMF Est.) |
Use code with caution.
Option 2: Combined CSV Format (Best for Excel, Google Sheets, or Data Tools)
(Copy and paste this into a spreadsheet, or save it as a .csv file. All countries are merged into a single table for easy sorting.)
csv
Country / Aggregate,Quarters Reported (2026),Q1 2026 (Q/Q),Q2 2026 (Q/Q),Q3 2026 (Q/Q),Cumulative YTD,Annualised YTD Rate
Ireland,3,-7.8%,10.2%,5.5%,7.19%,9.70%
Slovenia,2,1.1%,1.8%,N/A,2.92%,5.92%
Denmark,2,1.5%,0.9%,N/A,2.41%,4.89%
Poland,2,0.6%,1.0%,N/A,1.61%,3.24%
Malta,2,0.5%,1.1%,N/A,1.61%,3.24%
Bulgaria,2,0.7%,0.7%,N/A,1.40%,2.83%
Latvia,2,0.6%,0.7%,N/A,1.30%,2.63%
Spain,3,0.6%,0.7%,0.6%,1.91%,2.56%
Estonia,3,1.0%,0.3%,0.6%,1.91%,2.56%
United Kingdom,3,0.6%,0.5%,0.7%,1.81%,2.42%
Sweden,3,-0.1%,1.5%,0.4%,1.80%,2.41%
Norway (EEA),2,0.4%,0.7%,N/A,1.10%,2.22%
Finland,3,0.7%,0.4%,0.5%,1.61%,2.15%
Netherlands,3,0.3%,0.7%,0.6%,1.61%,2.15%
Cyprus,2,0.2%,0.8%,N/A,1.00%,2.01%
European Union (EU-27),3,0.1%,0.7%,0.5%,1.30%,1.74%
Portugal,3,0.2%,0.9%,0.2%,1.30%,1.74%
Hungary,3,0.6%,0.6%,0.1%,1.30%,1.74%
Euro Area (EA-21),3,0.0%,0.6%,0.4%,1.00%,1.34%
Germany,3,0.4%,0.3%,0.2%,0.90%,1.21%
Czechia,3,0.1%,0.3%,0.5%,0.90%,1.20%
Iceland (EEA),2,3.7%,-3.0%,N/A,0.59%,1.18%
Greece,2,0.2%,0.3%,N/A,0.50%,1.00%
Liechtenstein (EEA),Annual Only,N/A,N/A,N/A,N/A,1.00%
Belgium,3,0.2%,0.1%,0.3%,0.60%,0.80%
Slovakia,2,0.2%,0.2%,N/A,0.40%,0.80%
Italy,3,0.3%,0.2%,0.0%,0.50%,0.67%
Lithuania,3,0.1%,1.4%,-1.0%,0.49%,0.65%
Croatia,2,-0.1%,0.4%,N/A,0.30%,0.60%
Austria,3,0.3%,-0.1%,0.2%,0.40%,0.53%
Romania,2,-0.1%,0.0%,N/A,-0.10%,-0.20%
France,3,-0.2%,0.0%,-0.1%,-0.30%,-0.40%
Luxembourg,2,0.3%,-0.9%,N/A,-0.60%,-1.20%
Use code with caution.
Would you like me to export this directly as a downloadable .xlsx (Excel) or .csv file, or convert it into another format like HTML or LaTeX?
AI responses may include mistakes. Learn more
Here is a plain text version you can copy and paste directly into an email, WhatsApp message, text message, or document without any messy code symbols or formatting breaking.
2026 Annualised GDP Growth (EEA, EU & UK)
(Ranked by annualised year-to-date pace based on latest reported quarters)
Reported through Q3 2026 (9 Months)
• Ireland: +9.70% annualised (Q1: -7.8% | Q2: +10.2% | Q3: +5.5%)
• Spain: +2.56% annualised (Q1: +0.6% | Q2: +0.7% | Q3: +0.6%)
• Estonia: +2.56% annualised (Q1: +1.0% | Q2: +0.3% | Q3: +0.6%)
• United Kingdom: +2.42% annualised (Q1: +0.6% | Q2: +0.5% | Q3: +0.7%)
• Sweden: +2.41% annualised (Q1: -0.1% | Q2: +1.5% | Q3: +0.4%)
• Finland: +2.15% annualised (Q1: +0.7% | Q2: +0.4% | Q3: +0.5%)
• Netherlands: +2.15% annualised (Q1: +0.3% | Q2: +0.7% | Q3: +0.6%)
• European Union (EU-27): +1.74% annualised (Q1: +0.1% | Q2: +0.7% | Q3: +0.5%)
• Portugal: +1.74% annualised (Q1: +0.2% | Q2: +0.9% | Q3: +0.2%)
• Hungary: +1.74% annualised (Q1: +0.6% | Q2: +0.6% | Q3: +0.1%)
• Euro Area (EA-21): +1.34% annualised (Q1: 0.0% | Q2: +0.6% | Q3: +0.4%)
• Germany: +1.21% annualised (Q1: +0.4% | Q2: +0.3% | Q3: +0.2%)
• Czechia: +1.20% annualised (Q1: +0.1% | Q2: +0.3% | Q3: +0.5%)
• Belgium: +0.80% annualised (Q1: +0.2% | Q2: +0.1% | Q3: +0.3%)
• Italy: +0.67% annualised (Q1: +0.3% | Q2: +0.2% | Q3: 0.0%)
• Lithuania: +0.65% annualised (Q1: +0.1% | Q2: +1.4% | Q3: -1.0%)
• Austria: +0.53% annualised (Q1: +0.3% | Q2: -0.1% | Q3: +0.2%)
• France: -0.40% annualised (Q1: -0.2% | Q2: 0.0% | Q3: -0.1%)
First Aspect
Squire
Or I would chose a longer time period...Brian - any thoughts on how those GDP figures make sense for an ardent rejoiner/remainer?
Attachments

C R
Squire
Or I would chose a longer time period...
You and your facts.

Rusty Nails
Country Member
If you had asked me I would question the selection of countries.
In the third quarter (Q3) of 2026, the United Kingdom recorded a real GDP growth rate of +0.7%, while the broader European Union (EU) grew by +0.5% and the Euro area grew by +0.4% compared to the previous quarter, according to data from the Office for National Statistics and Eurostat.
Q3 2026 Quarterly GDP Growth (Q/Q) - Key Figures & Country Data
Country / Aggregate Q3 2026 GDP Growth (Q/Q) Annual Change (YoY)
Ireland +5.5% N/A
United Kingdom +0.7% +1.9%
Netherlands +0.6% N/A
Spain +0.6% N/A
Estonia +0.6% N/A
European Union (EU-27) +0.5% +1.5%
Euro Area (EA-20) +0.4% +1.3%
Germany +0.2% N/A
France -0.1% N/A
Lithuania -1.0% N/A
(Note: Eurostat releases preliminary flash estimates by member state incrementally; complete final breakdowns for all 27 EU single market countries are updated in subsequent national accounts schedules.)
Highlights by Region
United Kingdom: Grew by 0.7% in Q3 2026 (following +0.5% in Q2), driven heavily by a 0.9% increase in the services sector.
European Union & Euro Area: EU GDP expanded by 0.5% quarterly (+1.5% year-on-year), while the Euro area grew by 0.4% (+1.3% year-on-year).
European Commission
Country Extremes: Ireland continued to post the highest reported quarterly growth at +5.5% (influenced by multinational and tech/AI-related output), whereas countries like Lithuania (-1.0%) and France (-0.1%) experienced contractions in Q3.
European Commission
+1
Would you like me to pull the detailed Q2 2026 data for all individual EU member states or focus on a specific country's sectoral breakdown?
AI responses may include mistakes. Learn more
Based on cumulative quarter-on-quarter real GDP growth through the latest 2026 national accounts releases from Eurostat and the Office for National Statistics, the United Kingdom has achieved an annualised year-to-date (YTD) growth rate of +2.42% (across Q1–Q3), outpacing the European Union (EU-27) at +1.74% and the Euro Area (EA-21) at +1.34%.
Methodology & Data Coverage
Annualisation Formula: Compounded YTD quarterly growth rates are annualised using
, where n is the number of reported quarters in 2026 (n=3 for countries with Q3 flash estimates; n=2 for countries reported through Q2).
EEA Scope: Includes all 27 EU member states plus Norway, Iceland, and Liechtenstein. Liechtenstein only publishes annual GDP figures (projected at +1.0% for 2026 by the IMF), so quarterly YTD annualisation is not available.
Trading Economics
+2
2026 Year-to-Date & Annualised Real GDP Growth (EEA, EU & UK)
Group 1: Countries with Q1–Q3 2026 Data Reported (n = 3 Quarters)
Country / Aggregate Q1 2026 (Q/Q) Q2 2026 (Q/Q) Q3 2026 (Q/Q) Cumulative YTD (9M) Annualised YTD Rate
Ireland (CSO Frontier) -7.8% +10.2% +5.5% +7.19% +9.70%
Spain +0.6% +0.7% +0.6% +1.91% +2.56%
Estonia +1.0% +0.3% +0.6% +1.91% +2.56%
United Kingdom +0.6% +0.5% +0.7% +1.81% +2.42%
Sweden -0.1% +1.5% +0.4% +1.80% +2.41%
Finland +0.7% +0.4% +0.5% +1.61% +2.15%
Netherlands +0.3% +0.7% +0.6% +1.61% +2.15%
European Union (EU-27) +0.1% +0.7% +0.5% +1.30% +1.74%
Portugal +0.2% +0.9% +0.2% +1.30% +1.74%
Hungary +0.6% +0.6% +0.1% +1.30% +1.74%
Euro Area (EA-21) 0.0% +0.6% +0.4% +1.00% +1.34%
Germany +0.4% +0.3% +0.2% +0.90% +1.21%
Czechia +0.1% +0.3% +0.5% +0.90% +1.20%
Belgium +0.2% +0.1% +0.3% +0.60% +0.80%
Italy +0.3% +0.2% 0.0% +0.50% +0.67%
Lithuania +0.1% +1.4% -1.0% +0.49% +0.65%
Austria +0.3% -0.1% +0.2% +0.40% +0.53%
France -0.2% 0.0% -0.1% -0.30% -0.40%
Group 2: Remaining EEA Countries with Q1–Q2 2026 Data Reported (n = 2 Quarters)
(Latest official quarterly figures compiled via Eurostat and Trading Economics; Q3 2026 national releases follow in late November and December.)
Country Q1 2026 (Q/Q) Q2 2026 (Q/Q) Cumulative YTD (6M) Annualised YTD Rate
Slovenia +1.1% +1.8% +2.92% +5.92%
Denmark +1.5% +0.9% +2.41% +4.89%
Poland +0.6% +1.0% +1.61% +3.24%
Malta +0.5% +1.1% +1.61% +3.24%
Bulgaria +0.7% +0.7% +1.40% +2.83%
Latvia +0.6% +0.7% +1.30% +2.63%
Norway (EEA) +0.4% +0.7% +1.10% +2.22%
Cyprus +0.2% +0.8% +1.00% +2.01%
Iceland (EEA) +3.7% -3.0% +0.59% +1.18%
Greece +0.2% +0.3% +0.50% +1.00%
Slovakia +0.2% +0.2% +0.40% +0.80%
Croatia -0.1% +0.4% +0.30% +0.60%
Romania -0.1% 0.0% -0.10% -0.20%
Luxembourg +0.3% -0.9% -0.60% -1.20%
Liechtenstein (EEA) Annual only Annual only N/A +1.00% (IMF Full-Year)
Key Takeaways
Major Economy Divergence: Among Europe's largest economies, Spain (+2.56% annualised) and the UK (+2.42% annualised) lead growth. Germany (+1.21%) and Italy (+0.67%) show modest positive momentum, while France (-0.40%) is in mild YTD contraction.
ICIS
Volatility Distortion: Ireland (+9.70% annualised) reflects heavy swings from multinational intellectual property and AI capital transfers (-7.8% in Q1 followed by +10.2% in Q2 and +5.5% in Q3). Similarly, Iceland (+1.18% annualised) saw a +3.7% Q1 surge largely offset by a -3.0% Q2 trade-driven contraction.
Statistics Iceland
+2
Eurostat releases its updated t+45 flash estimate on 13 November 2026 and comprehensive Q3 country breakdowns on 7 December 2026. Would you like me to set up a task to update this table once the remaining EEA countries report their Q3 figures, or compare these annualised rates against full-year 2026 IMF and OECD forecasts?
AI responses may include mistakes. Learn more
Here are the tables formatted in clean Markdown and CSV so you can easily copy and paste them into documents, emails, Slack, Notion, or spreadsheet software like Excel and Google Sheets.
Option 1: Clean Markdown (Best for Notion, Slack, GitHub, or Docs)
(Click the copy icon in the top-right corner of the code block below.)
markdown
### 2026 Year-to-Date & Annualised Real GDP Growth (EEA, EU & UK)
#### Group 1: Countries with Q1–Q3 2026 Data Reported (n = 3 Quarters)
| Country / Aggregate | Q1 2026 | Q2 2026 | Q3 2026 | Cumulative YTD (9M) | Annualised YTD Rate |
| :--- | :--- | :--- | :--- | :--- | :--- |
| Ireland | -7.8% | +10.2% | +5.5% | +7.19% | +9.70% |
| Spain | +0.6% | +0.7% | +0.6% | +1.91% | +2.56% |
| Estonia | +1.0% | +0.3% | +0.6% | +1.91% | +2.56% |
| United Kingdom | +0.6% | +0.5% | +0.7% | +1.81% | +2.42% |
| Sweden | -0.1% | +1.5% | +0.4% | +1.80% | +2.41% |
| Finland | +0.7% | +0.4% | +0.5% | +1.61% | +2.15% |
| Netherlands | +0.3% | +0.7% | +0.6% | +1.61% | +2.15% |
| European Union (EU-27) | +0.1% | +0.7% | +0.5% | +1.30% | +1.74% |
| Portugal | +0.2% | +0.9% | +0.2% | +1.30% | +1.74% |
| Hungary | +0.6% | +0.6% | +0.1% | +1.30% | +1.74% |
| Euro Area (EA-21) | 0.0% | +0.6% | +0.4% | +1.00% | +1.34% |
| Germany | +0.4% | +0.3% | +0.2% | +0.90% | +1.21% |
| Czechia | +0.1% | +0.3% | +0.5% | +0.90% | +1.20% |
| Belgium | +0.2% | +0.1% | +0.3% | +0.60% | +0.80% |
| Italy | +0.3% | +0.2% | 0.0% | +0.50% | +0.67% |
| Lithuania | +0.1% | +1.4% | -1.0% | +0.49% | +0.65% |
| Austria | +0.3% | -0.1% | +0.2% | +0.40% | +0.53% |
| France | -0.2% | 0.0% | -0.1% | -0.30% | -0.40% |
#### Group 2: Remaining EEA Countries with Q1–Q2 2026 Data Reported (n = 2 Quarters)
| Country | Q1 2026 | Q2 2026 | Cumulative YTD (6M) | Annualised YTD Rate |
| :--- | :--- | :--- | :--- | :--- |
| Slovenia | +1.1% | +1.8% | +2.92% | +5.92% |
| Denmark | +1.5% | +0.9% | +2.41% | +4.89% |
| Poland | +0.6% | +1.0% | +1.61% | +3.24% |
| Malta | +0.5% | +1.1% | +1.61% | +3.24% |
| Bulgaria | +0.7% | +0.7% | +1.40% | +2.83% |
| Latvia | +0.6% | +0.7% | +1.30% | +2.63% |
| Norway (EEA) | +0.4% | +0.7% | +1.10% | +2.22% |
| Cyprus | +0.2% | +0.8% | +1.00% | +2.01% |
| Iceland (EEA) | +3.7% | -3.0% | +0.59% | +1.18% |
| Greece | +0.2% | +0.3% | +0.50% | +1.00% |
| Slovakia | +0.2% | +0.2% | +0.40% | +0.80% |
| Croatia | -0.1% | +0.4% | +0.30% | +0.60% |
| Romania | -0.1% | 0.0% | -0.10% | -0.20% |
| Luxembourg | +0.3% | -0.9% | -0.60% | -1.20% |
| Liechtenstein (EEA) | N/A | N/A | N/A | +1.00% (IMF Est.) |
Use code with caution.
Option 2: Combined CSV Format (Best for Excel, Google Sheets, or Data Tools)
(Copy and paste this into a spreadsheet, or save it as a .csv file. All countries are merged into a single table for easy sorting.)
csv
Country / Aggregate,Quarters Reported (2026),Q1 2026 (Q/Q),Q2 2026 (Q/Q),Q3 2026 (Q/Q),Cumulative YTD,Annualised YTD Rate
Ireland,3,-7.8%,10.2%,5.5%,7.19%,9.70%
Slovenia,2,1.1%,1.8%,N/A,2.92%,5.92%
Denmark,2,1.5%,0.9%,N/A,2.41%,4.89%
Poland,2,0.6%,1.0%,N/A,1.61%,3.24%
Malta,2,0.5%,1.1%,N/A,1.61%,3.24%
Bulgaria,2,0.7%,0.7%,N/A,1.40%,2.83%
Latvia,2,0.6%,0.7%,N/A,1.30%,2.63%
Spain,3,0.6%,0.7%,0.6%,1.91%,2.56%
Estonia,3,1.0%,0.3%,0.6%,1.91%,2.56%
United Kingdom,3,0.6%,0.5%,0.7%,1.81%,2.42%
Sweden,3,-0.1%,1.5%,0.4%,1.80%,2.41%
Norway (EEA),2,0.4%,0.7%,N/A,1.10%,2.22%
Finland,3,0.7%,0.4%,0.5%,1.61%,2.15%
Netherlands,3,0.3%,0.7%,0.6%,1.61%,2.15%
Cyprus,2,0.2%,0.8%,N/A,1.00%,2.01%
European Union (EU-27),3,0.1%,0.7%,0.5%,1.30%,1.74%
Portugal,3,0.2%,0.9%,0.2%,1.30%,1.74%
Hungary,3,0.6%,0.6%,0.1%,1.30%,1.74%
Euro Area (EA-21),3,0.0%,0.6%,0.4%,1.00%,1.34%
Germany,3,0.4%,0.3%,0.2%,0.90%,1.21%
Czechia,3,0.1%,0.3%,0.5%,0.90%,1.20%
Iceland (EEA),2,3.7%,-3.0%,N/A,0.59%,1.18%
Greece,2,0.2%,0.3%,N/A,0.50%,1.00%
Liechtenstein (EEA),Annual Only,N/A,N/A,N/A,N/A,1.00%
Belgium,3,0.2%,0.1%,0.3%,0.60%,0.80%
Slovakia,2,0.2%,0.2%,N/A,0.40%,0.80%
Italy,3,0.3%,0.2%,0.0%,0.50%,0.67%
Lithuania,3,0.1%,1.4%,-1.0%,0.49%,0.65%
Croatia,2,-0.1%,0.4%,N/A,0.30%,0.60%
Austria,3,0.3%,-0.1%,0.2%,0.40%,0.53%
Romania,2,-0.1%,0.0%,N/A,-0.10%,-0.20%
France,3,-0.2%,0.0%,-0.1%,-0.30%,-0.40%
Luxembourg,2,0.3%,-0.9%,N/A,-0.60%,-1.20%
Use code with caution.
Would you like me to export this directly as a downloadable .xlsx (Excel) or .csv file, or convert it into another format like HTML or LaTeX?
AI responses may include mistakes. Learn more
Here is a plain text version you can copy and paste directly into an email, WhatsApp message, text message, or document without any messy code symbols or formatting breaking.
2026 Annualised GDP Growth (EEA, EU & UK)
(Ranked by annualised year-to-date pace based on latest reported quarters)
Reported through Q3 2026 (9 Months)
• Ireland: +9.70% annualised (Q1: -7.8% | Q2: +10.2% | Q3: +5.5%)
• Spain: +2.56% annualised (Q1: +0.6% | Q2: +0.7% | Q3: +0.6%)
• Estonia: +2.56% annualised (Q1: +1.0% | Q2: +0.3% | Q3: +0.6%)
• United Kingdom: +2.42% annualised (Q1: +0.6% | Q2: +0.5% | Q3: +0.7%)
• Sweden: +2.41% annualised (Q1: -0.1% | Q2: +1.5% | Q3: +0.4%)
• Finland: +2.15% annualised (Q1: +0.7% | Q2: +0.4% | Q3: +0.5%)
• Netherlands: +2.15% annualised (Q1: +0.3% | Q2: +0.7% | Q3: +0.6%)
• European Union (EU-27): +1.74% annualised (Q1: +0.1% | Q2: +0.7% | Q3: +0.5%)
• Portugal: +1.74% annualised (Q1: +0.2% | Q2: +0.9% | Q3: +0.2%)
• Hungary: +1.74% annualised (Q1: +0.6% | Q2: +0.6% | Q3: +0.1%)
• Euro Area (EA-21): +1.34% annualised (Q1: 0.0% | Q2: +0.6% | Q3: +0.4%)
• Germany: +1.21% annualised (Q1: +0.4% | Q2: +0.3% | Q3: +0.2%)
• Czechia: +1.20% annualised (Q1: +0.1% | Q2: +0.3% | Q3: +0.5%)
• Belgium: +0.80% annualised (Q1: +0.2% | Q2: +0.1% | Q3: +0.3%)
• Italy: +0.67% annualised (Q1: +0.3% | Q2: +0.2% | Q3: 0.0%)
• Lithuania: +0.65% annualised (Q1: +0.1% | Q2: +1.4% | Q3: -1.0%)
• Austria: +0.53% annualised (Q1: +0.3% | Q2: -0.1% | Q3: +0.2%)
• France: -0.40% annualised (Q1: -0.2% | Q2: 0.0% | Q3: -0.1%)
I commend you for the effort you put into this post.

AndyRM
Elder Goth
The plan to open the asylum centre near Piddington has been approved...
https://www.bbc.co.uk/news/articles/c58j4798874go
I wonder if they'll push for independence again? They'd probably be able to make use of the facility when they realise their nation is rubbish and they want back into the UK.
https://www.bbc.co.uk/news/articles/c58j4798874go
I wonder if they'll push for independence again? They'd probably be able to make use of the facility when they realise their nation is rubbish and they want back into the UK.

Pross
Guru
The plan to open the asylum centre near Piddington has been approved...
https://www.bbc.co.uk/news/articles/c58j4798874go
I wonder if they'll push for independence again? They'd probably be able to make use of the facility when they realise their nation is rubbish and they want back into the UK.
Oh dear, what a shame.

Dorset Boy
Über Member
Global Microsoft 365 outage this morning.
No emails, no calendars, no Teams meetings etc
No emails, no calendars, no Teams meetings etc
Pross
Guru
Global Microsoft 365 outage this morning.
No emails, no calendars, no Teams meetings etc
Picked a bad day to use annual leave!

Pblakeney
Shaman
The plan to open the asylum centre near Piddington has been approved...
https://www.bbc.co.uk/news/articles/c58j4798874go
I wonder if they'll push for independence again? They'd probably be able to make use of the facility when they realise their nation is rubbish and they want back into the UK.
Give them their independence, then welcome them back after a few years on worse terms.
That seems to be the way it works.
C R
Squire
Global Microsoft 365 outage this morning.
No emails, no calendars, no Teams meetings etc
For us everything is working except Outlook.


